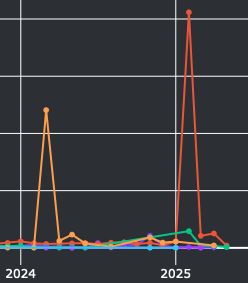
Telling stories with data
At Inkwell Global Report, we transform data into meaning through compelling visualizations and story-driven dashboards. Our approach to data storytelling combines design, analytics, and narrative to illuminate patterns, highlight disparities, and guide strategic action. Whether the goal is to persuade a funder, inform a policy, or support operational decisions, we build tools that engage both the analytical and intuitive mind. From interactive dashboards to focused infographics, our work helps decision-makers grasp complexity at a glance—and act with confidence.
Examples of Work

